Response Order Can Affect Sexual Orientation Measurement
Authors
April 2024
This brief poses a classic survey design question about how the order of response categories affects measurement. We assess this issue in a nationally representative study that asked about sexual orientation.
NORC researchers have spent years examining how best to measure sexual majority and sexual minority populations. Their goal is to inform research on the best methods for gathering survey data on sexual orientation.
Background
When designing survey questionnaires, nominal questions with categories that are not naturally ordered in some ways are often ordered by population prevalence, starting with the most common response in the population. Current best practice in sexual orientation measurement is an exception, with “lesbian or gay” recommended as the first response category followed by the second but most commonly selected category, “straight, that is, not lesbian or gay” (National Academies of Sciences, Engineering, and Medicine 2022). Prior studies have shown the order of response categories can cause differences in response distributions. These differences are called “context effects” (e.g., Smyth, Dillman, and Christian 2007). The potential impact of context effects on sexual orientation measurement has not been fully investigated.
Better measurement of sexual orientation has several benefits.
Sexual orientation is important data to collect in a variety of social, health, and economic research. Better measures of sexual orientation can improve estimates of sexual minority populations (i.e., those who are lesbian, gay, bisexual, etc.), facilitate more rigorous analysis of the disparities impacting sexual minority communities, and supply data for evidence-based interventions supporting sexual minority communities.
Advancing best practices in sexual orientation measurement improves both minority population research and general population studies, as measures must be valid and reliable for both sexual minorities and sexual majorities (i.e., people who are heterosexual). National organizations like NASEM and federal bodies like the U.S. Office of Management and Budget (OMB) have recently published guidance on sexual orientation measurement, which speaks to its salience as a general population concern (NASEM 2022; OMB 2023).
Our Research
NORC conducted an experiment to study context effects on sexual orientation measurement.
NORC surveyed 2,099 adults age 18+ in October and November 2022 using AmeriSpeak®, NORC’s probability-based survey panel, which is representative of the U.S. household population. As part of an omnibus survey, panelists were asked, “Which of the following best represents how you think of yourself?” with response categories “Lesbian or gay,” “Straight, that is, not lesbian or gay,” “Bisexual,” “Something else,” and “I don’t know the answer.”
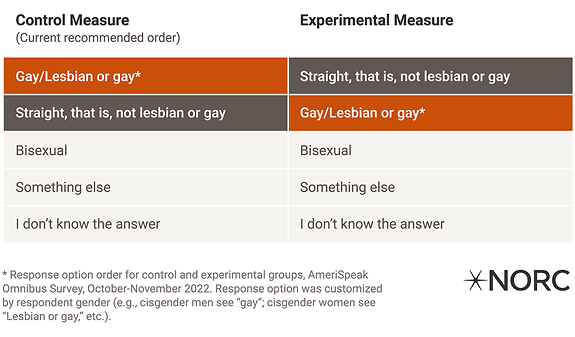
NORC randomly assigned respondents to one of two groups. The control group saw the standard ordering “Lesbian or gay” followed by “Straight, that is, not lesbian or gay.” The experimental group saw “Straight, that is, not lesbian or gay” followed by “Lesbian or gay.” The order of the remaining responses was the same for both groups.
If response options were listed by population prevalence, the response “bisexual” would be listed second as the largest sexual minority group. However, for our experimental measure, we placed “lesbian or gay” second because of the use of “not lesbian or gay” in the definition of straight (the first response option). These are the sexual orientation measures used in the study.
Fig. The order of the control and experiment question options.

Study
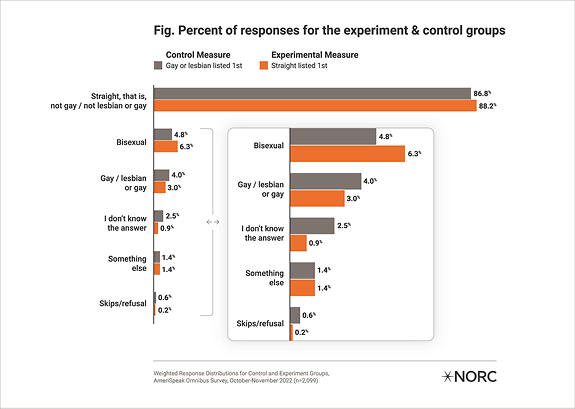
We saw lower levels of nonresponse when “Straight, that is, not lesbian or gay” was listed first.
Compared to the control measure, the experimental measure saw a significant decrease in proportion for “I don’t know the answer.” Differences in proportions were not significant for the remaining responses. The significant decrease in “I don’t know the answer” in the experimental measure suggests an overall improvement in data quality. Item nonresponse is an important indicator of data quality, and in sexual orientation measurement, item nonresponse below 5.5 percent is considered “low” (NASEM 2022).
Notably, a response of “I don’t know the answer” in this study could have multiple interpretations, including “I don’t know what this question is asking”; “I understand the question, but I’m questioning how I identify”; “I don’t want to provide an answer”; or an indication of response satisficing. Our experimental measure had a smaller percentage of “I don’t know the answer” responses than the control measure (0.9 vs. 2.5 percent) and other national survey data that listed “lesbian or gay” as the first response option (the 2020 Behavioral Risk Factor Surveillance System was at 1.9 percent, the 2020 National Health Interview Survey at 2.6 percent, and the 2021 Census Pulse [cycles 34-39] at 2.2 percent).

Our study has several implications for future research. Future research into context effects in sexual orientation measurement may test listing “bisexual” second, based on population prevalence, and presenting “straight” with and without the phrase “that is, not gay or lesbian.” Such research may consider how these measurement differences might affect conclusions about disparities impacting sexual minority communities.
Future analysis for the present study will focus on understanding demographic characteristics associated with item nonresponse observed in the experiment, with a focus on differences by panelists’ age, education, and race and ethnicity. We intend to publish full findings, including demographic analysis, in 2024.
Acknowledgments: The authors thank Leah Christian and Nola du Toit for their support.


