Live Crime Tracker

Problem
Changes in the reporting of national crime statistics have reduced the amount of timely data available to researchers, policymakers, and the public.
In 2021, the FBI changed the way national crime statistics are reported, reducing the amount of data available to the public and policymakers. Prior to January 2021, the 18,600 local law enforcement agencies (LEAs) in the U.S. reported summary data to the FBI detailing the total number of serious crimes each month. After January 2021, the FBI required that LEAs report data for each reported crime rather than aggregate totals. As of January 2023, the response rate for LEAs has declined from 95 percent to about 67 percent. The consequence of this change is that national crime statistics are no longer a census but an estimate.
The lack of public and researcher access to real-time crime statistics represents a critical gap in the U.S. data infrastructure. When data are limited, policymakers and the public often base decisions on emotion and ideology. In the case of crime policy, this substitution results in solutions to crime that are less efficient, less effective, and less responsive.
Filling the data void would serve strategic and logistic purposes in facilitating better communication to policymakers and the public, and developing a resource for city leaders, policymakers, and stakeholders.
Solution
NORC developed a daily crime tracker that integrates data from more than 50 of the nation’s largest cities.
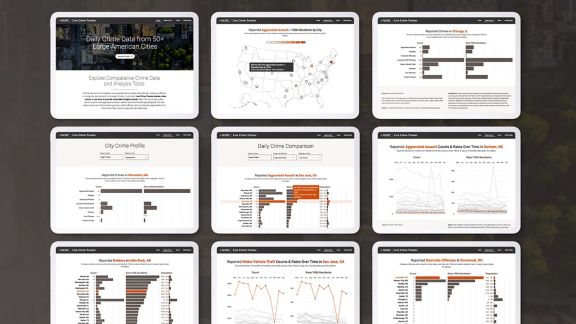
To meet the pressing need for timely, comparable crime data, NORC developed Live Crime Tracker, a data dashboard that gathers the crime statistics reported by more than 50 of the nation’s largest cities. Our work on Live Crime Tracker included:
- Discovery. Among the 200 largest U.S. cities, we identified more than 50 that regularly report daily crime data.
- Data Scraping. Python code scrapes data for more than 50 cities, including a process flow for automated daily updates.
- Data Normalization & Harmonization. Included within the daily automated pipeline, data is normalized, harmonized, and ingested into the dashboard.
- Dashboard Design & Development. An R Shiny application utilizes up-to-date data, applies user experience best practices, and incorporates principles of effective data visualization design. The dashboard has been tested for web security and user accessibility.
Result
Users can visualize and analyze daily, monthly, and yearly trends across eight property and violent crime categories.
Live Crime Tracker provides daily updates on eight property and violent crime categories in more than 50 large U.S. cities. The site lets users visualize and analyze daily, monthly, and yearly crime trends and compare crime and victimization across cities.
Live Crime Tracker compiles data shared by local governments, and some of those data are incomplete. We have intentionally exposed those gaps in data, because encouraging more depth and consistency of data is one of our goals. Timely, accurate, and reliable data-sharing is a cornerstone of fair and effective policymaking. Find your city’s data source on the Methodology page of the tracker.
Related Tags
Project Leads
-
John Roman
DirectorCo-Principal Investigator -
Asheley Van Ness
Associate DirectorCo-Principal Investigator -
Kiegan Rice
Senior Statistician


